2.1. Query window
The Query Window lets you create SQL queries, view query results, and edit data. To open a new Query Window, select Query → New query window from the menu or right-click a connection and select Open Query Window.
A Query Window is always associated with a single database connection:
- Query data on a table runs
SELECT * FROM tableusing the active connection. - Open Query Window opens an empty window bound to the chosen connection.
- The connection is fixed; all edits apply only to that connection.
A Query Window consists of three main areas:
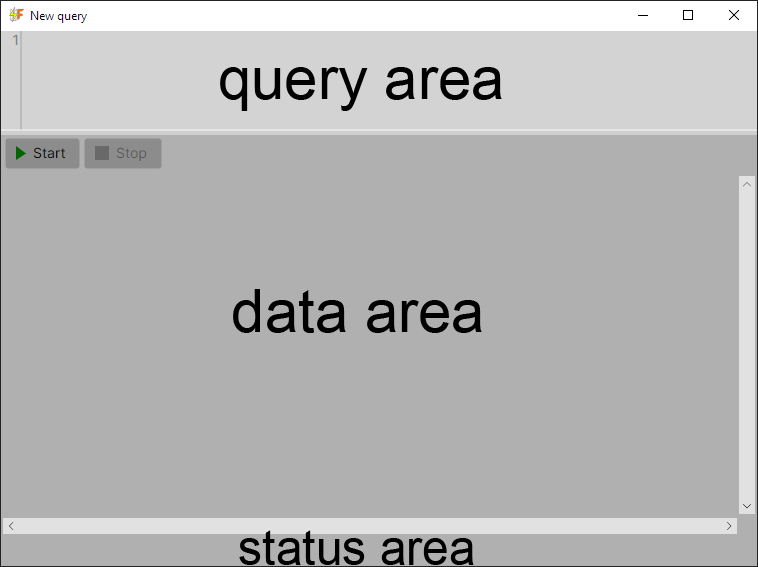
- Query area – for writing SQL queries
- Data area – for displaying and editing query results
- Status area – for progress and execution status
Between the Query area and Data area is a toolbar with the following buttons:
- Start – execute the current query
- Stop – cancel running query
- Apply – apply pending edits
- Preview – show generated SQL for pending edits
- Discard – cancel pending edits
- Export Data – export query results (appears after fetch completes and at least one row is present)
Query Area
The Query area is a text field where you can write SQL queries. It supports syntax highlighting and autocompletion.
Keyboard shortcuts:
⌘/Ctrl + Enter– run the current query⌘/Ctrl + Space– stop running query
Data Area
The Data area displays query results. Left-click a cell to enter navigation mode.
Navigation mode keyboard shortcuts are described in 2.2. Edit mode.
Edits are possible in the Data area, including joined tables, as long as the row contains a visible primary key. Preview, Apply, and Discard buttons appear when there are pending edits.
- Preview shows the SQL statements but cannot be edited.
- Apply executes statements sequentially. Failed rows are marked with red triangles; other rows continue.
- Discard cancels pending changes.
Status Area
The status area is used for the fetch progress bar and result summary. On success, it displays the number of rows fetched and the fetch time. On error, it shows the exception message.
Progress bar at the bottom shows row count during fetch (without percentage). At the end, total rows and elapsed time are displayed.
Notes
- Export Data launches a streaming export of query results. Supported formats and details are covered in 2.3. Export data.
- Import Data is available from the Project Explorer and is covered in 2.4. Import data.
- All data edits respect the primary key requirements as described in 2.2. Edit mode.
- Autoscroll scrolls the grid to the last row during fetch, giving a visual sense of data flow.
- Autoscroll stops if the user clicks the grid or moves the vertical scrollbar.